The Data Behind Carrier and Service-Level Risk in Package Shipping
Every outbound shipment involves a handful of quick choices: which carrier, which service level, which rate tier. Most of those choices get made on cost and speed, then repeated by habit. The data on carrier reliability and transit damage tells a different story. Those choices carry real, measurable risk — and that risk shifts from year to year.
Carrier Reliability Isn't Fixed, and It Isn't Equal
Shippers tend to treat carrier choice as a settled question: pick a reliable name, stick with it. The data says reliability itself moves.
Pitney Bowes' 2026 Parcel Shipping Index found on-time delivery improved across the board during peak season 2025. USPS climbed to 94.1%, up from 90.4% the year before. FedEx rose to 95.3%, up from 91.8%. UPS started closest to full reliability already and still improved, from 96.5% to 97.2%. Those gains came alongside falling volume — UPS down 8.7% year-over-year, USPS down 8.8% — which eased network strain and let carriers loosen delivery windows.
At the same time, regional and alternative carriers grew 127% year-over-year, according to the same report, largely by competing on price and regional speed. The index also notes a real trade-off behind that growth: “delivery tracking and reliability are opportunities for improvement” for those carriers. A cheaper, faster-looking option isn't automatically a worse choice. It's a different risk profile that doesn't show up on a rate sheet.
Damage Risk Is Bigger, and More Physical, Than Most Shippers Assume
Reliability covers whether a package arrives on time. It says nothing about what condition it arrives in.
A Harris Poll survey conducted for DS Smith in November 2024 put a number on it. 700 million packages arrive damaged in the US every year — an estimated $48.5 billion problem. Sixty percent of Americans said they'd received damaged goods from an online retailer that year alone. The most common damage types were mechanical, not incidental — crushed, torn, or smashed contents from handling, not weather or theft.
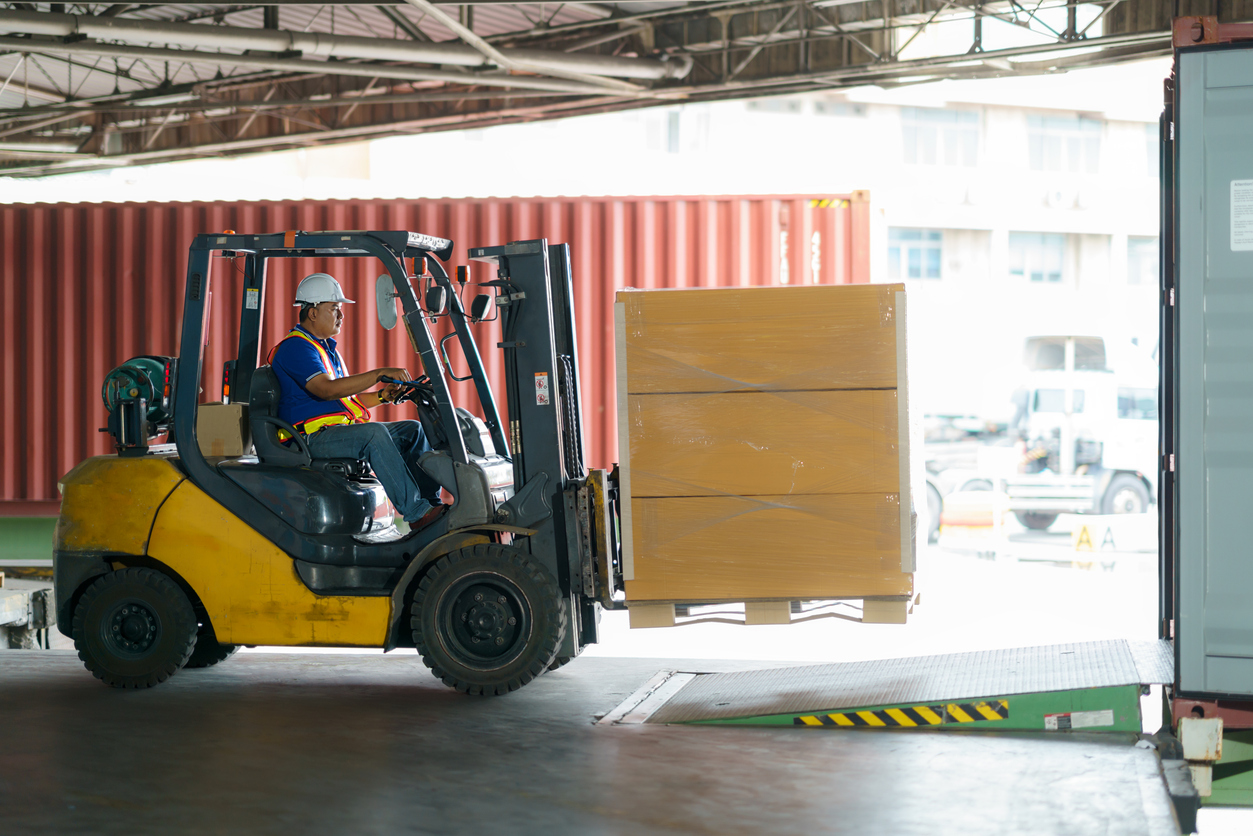
The same survey found packages can hit up to 50 G-forces in transit. That’s five times what it takes to knock an astronaut unconscious. That's not a scare statistic. It's a description of what “handling” means between a warehouse dock and a front porch. Drops. Stacking. Sorting equipment. Multiple transfers. Each one is a chance for something to go wrong.
Freight shipping already has the data to show why transfers matter. A 2025 Flock Freight shipper study found that traditional LTL freight, moved through a standard five-touch handling sequence, damages at a rate of 1.24%. A cross-dock model that cuts the sequence to two touches brought that down to 0.81%, a 35% reduction, across more than 800,000 shipments. That's freight data, not parcel data, and the two don't move through identical systems. But the underlying mechanism is the same one behind the parcel damage numbers above. Fewer handoffs means fewer chances for something to go wrong.
What a Data-Informed Choice Looks Like
None of this means the cheapest or fastest option is wrong. It means the choice carries information a rate sheet doesn't show. How has that carrier or service level been performing lately? How much handling stands between pickup and delivery?
For a shipper checking this against their own data, three questions do most of the work. Has this carrier's on-time and damage performance changed in the past year, not just at onboarding? Does the cheaper or faster option route through more transfer points than the standard one? And for anything valuable enough that damage or delay is a real loss: does the service level and signature requirement reflect that value today?
That last question is where Cabrella's own data comes in. Cabrella's Pre-Ship Decision Support uses proprietary claims data to help clients make carrier, service level, and signature decisions before a label prints. Same questions. Checked against outcomes instead of assumptions. (For more on where gut instinct tends to get shipping decisions wrong, see Gut Check.)
Talk to a Cabrella specialist about what your own carrier and service-level data would show.
Common Questions about Shipping and Carrier Risk
Does carrier on-time performance change year to year?
Yes. Pitney Bowes' 2026 Parcel Shipping Index recorded meaningful swings in a single year. USPS improved 3.7 percentage points and FedEx 3.5, comparing 2024 and 2025's peak seasons. Falling shipment volume eased network strain and helped drive the gain.
Are regional or alternative carriers less reliable than national carriers?
Not automatically. The Pitney Bowes index found they compete mainly on price and regional speed, with reliability flagged as an area needing improvement. It's a trade-off to check, not assume.
How much shipping damage happens, and why?
A Harris Poll survey for DS Smith found 700 million US packages arrive damaged annually, at an estimated $48.5 billion cost. Most reported damage was mechanical — crushed, torn, or smashed contents — consistent with forces up to 50 Gs in transit.
Does the number of handoffs a shipment goes through affect damage risk?
Freight data supports it directly. A 2025 study found LTL freight moved through five handling touches damaged at 1.24%, versus 0.81% with a two-touch model — a 35% reduction. Parcel shipping hasn't published an equivalent study, but the same physical mechanism — more transfers, more chances for mishandling — applies.
How often should a business revisit its carrier and service-level choices?
At least once a year, and any time volume, order value, or carrier performance shifts. The data above shows carrier reliability isn't static — a choice made at onboarding can be outdated within a year.

Subscribe for Email Updates